Paper path and alginment generation
[1]:
import warnings

import numpy as np

warnings.filterwarnings("ignore")  # Hide warnings

# dummy time series data
x = np.array(
    [
        0.7553383207,
        0.4460987596,
        1.197682907,
        0.1714334808,
        0.5639929213,
        0.6891222874,
        1.793828873,
        0.06570866314,
        0.2877381702,
        1.633620422,
    ]
)
y = np.array(
    [
        -0.01765193577,
        -1.536784164,
        -0.1413292622,
        -0.7609346135,
        -0.1767363331,
        -2.192007072,
        -0.1933165696,
        -0.4648166839,
        -0.9444888843,
        -0.239523623,
    ]
)
[2]:
# Find the distance between time series
from aeon.distances import distance

dtw = distance(x, y, metric="dtw")
dtw_windowed = distance(x, y, metric="dtw", window=0.2)
edr = distance(x, y, metric="edr")
erp = distance(x, y, metric="erp", epsilon=1.0)
lcss = distance(x, y, metric="lcss")
msm = distance(x, y, metric="msm")
twe = distance(x, y, metric="twe")
wdtw = distance(x, y, metric="wdtw")
wdtw_g2 = distance(x, y, metric="wdtw", g=0.2)
wdtw_g3 = distance(x, y, metric="wdtw", g=0.3)
[3]:
# Generate the path for each distance
from aeon.distances import alignment_path

dtw_path = alignment_path(x, y, metric="dtw")
dtw_path_windowed = alignment_path(x, y, metric="dtw", window=0.2)
edr_path = alignment_path(x, y, metric="edr")
erp_path = alignment_path(x, y, metric="erp", epsilon=1.0)
lcss_path = alignment_path(x, y, metric="lcss")
msm_path = alignment_path(x, y, metric="msm")
twe_path = alignment_path(x, y, metric="twe")
wdtw_path = alignment_path(x, y, metric="wdtw")
wdtw_path_g2 = alignment_path(x, y, metric="wdtw", g=0.2)
wdtw_path_g3 = alignment_path(x, y, metric="wdtw", g=0.3)
[4]:
# This function does the above but generates a graph from it
from tsml_eval.publications.y2023.distance_based_clustering._plot_path import (
    _plot_alignment,
    _plot_path,
)

plt_path = _plot_path(x, y, metric="dtw", title="dtw path window 0.2")
plt_path.show()
plt_alignment = _plot_alignment(x, y, metric="dtw", title="dtw alignment window 0.2")
plt_alignment.show()
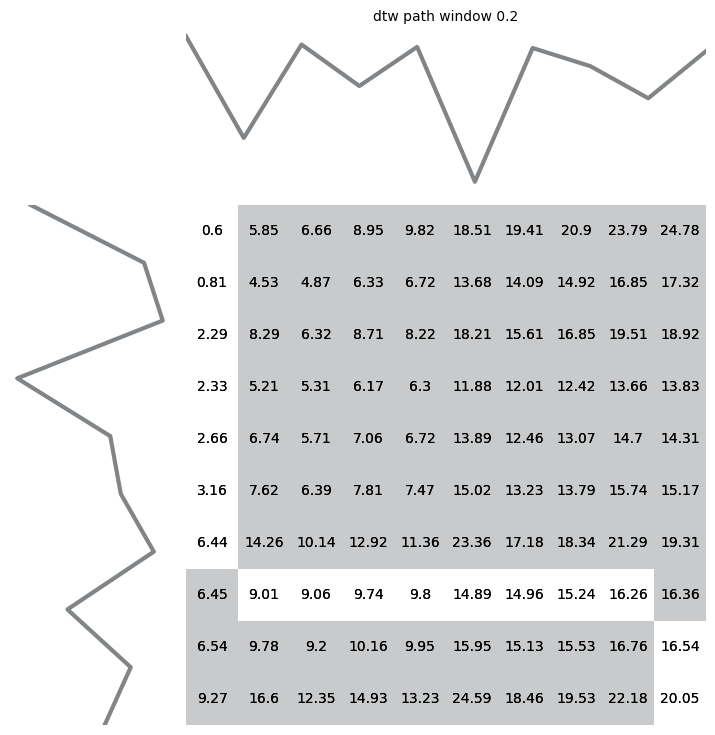
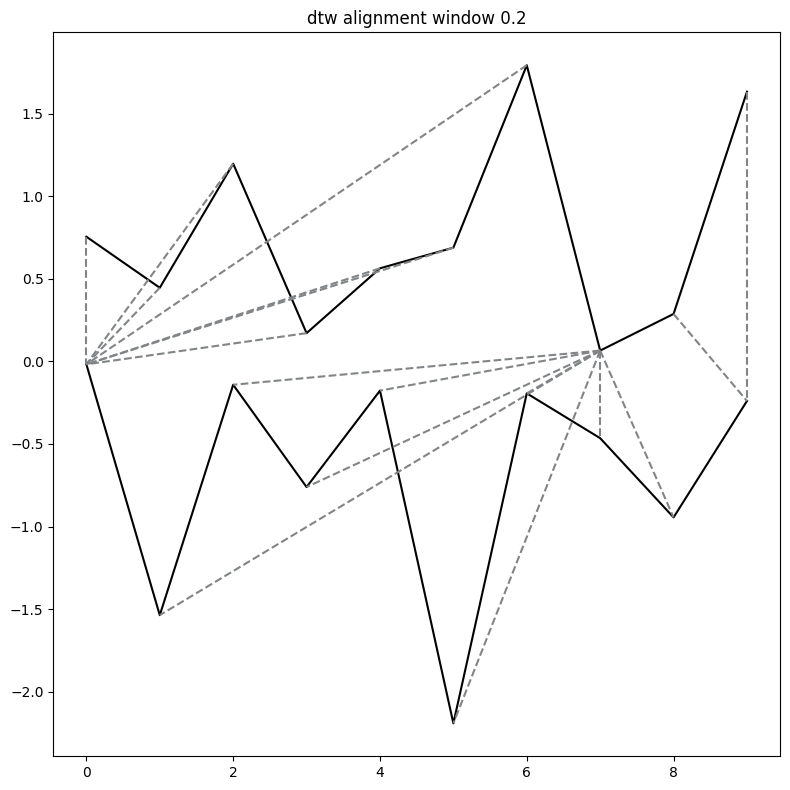
[5]:
plt_path = _plot_path(
    x, y, metric="dtw", title="dtw path window 0.2", dist_kwargs={"window": 0.2}
)
plt_path.show()
plt_alignment = _plot_alignment(
    x, y, metric="dtw", title="dtw alignment window 0.2", dist_kwargs={"window": 0.2}
)
plt_alignment.show()
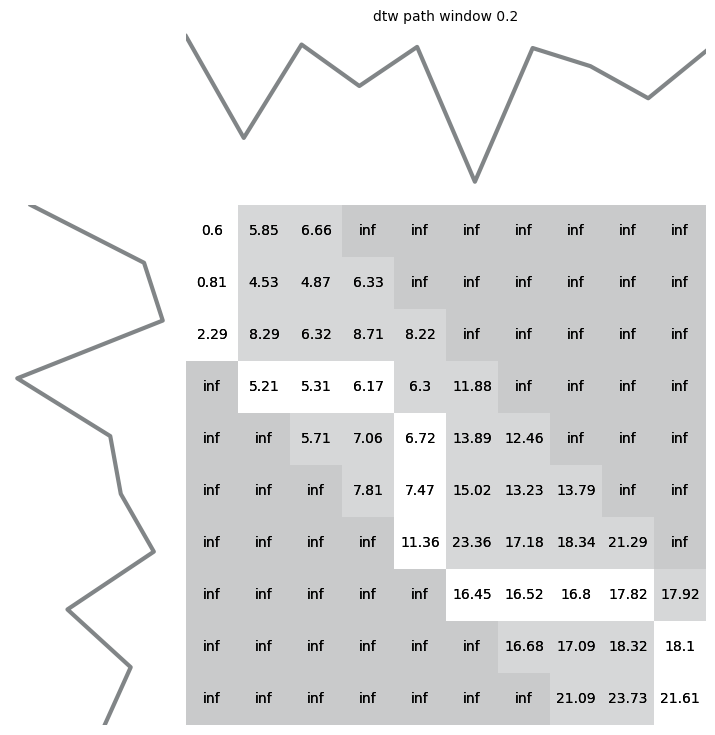
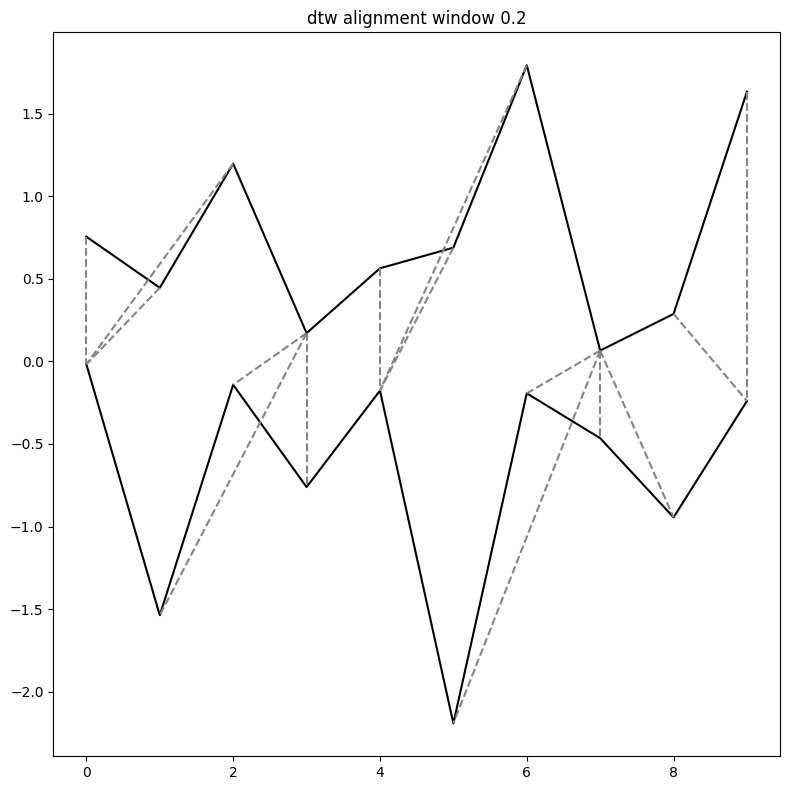
[6]:
plt_path = _plot_path(
    x, y, metric="edr", title="edr path", dist_kwargs={"epsilon": 1.0}
)
plt_path.show()
plt_alignment = _plot_alignment(
    x, y, metric="edr", title="edr alignment", dist_kwargs={"epsilon": 0.2}
)
plt_alignment.show()
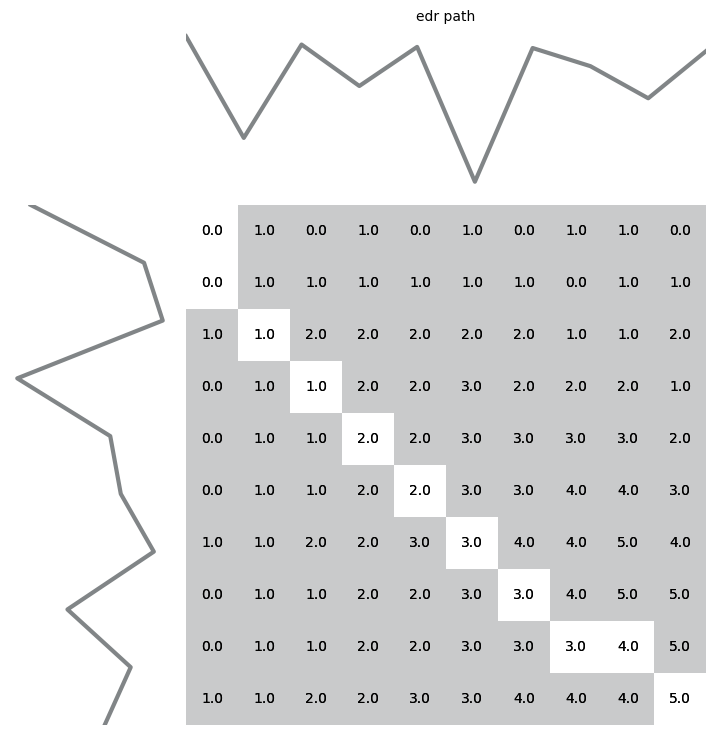
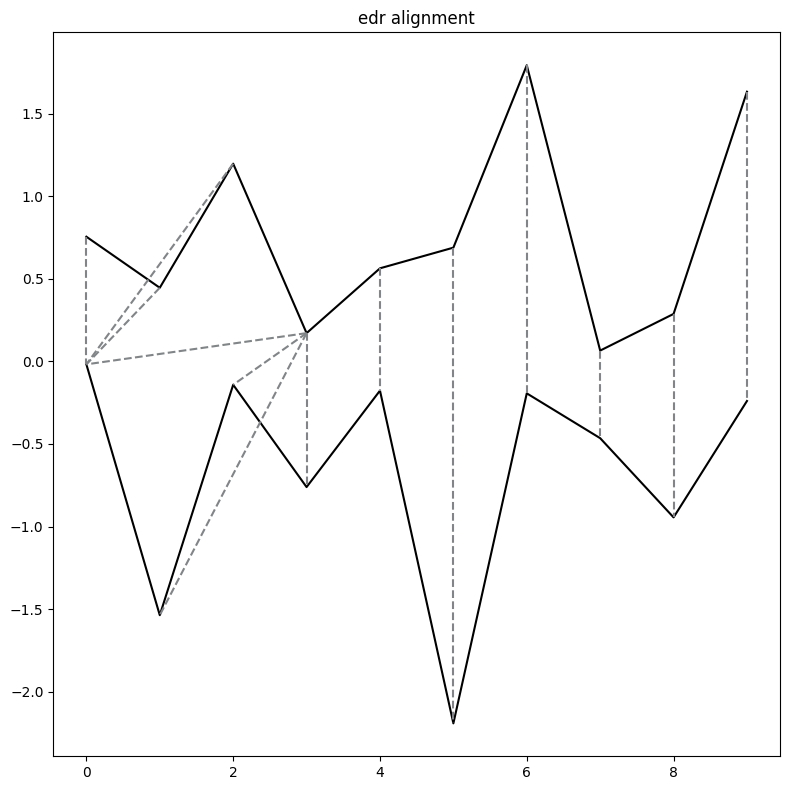
[7]:
plt_path = _plot_path(x, y, metric="erp", title="erp path")
plt_path.show()
plt_alignment = _plot_alignment(x, y, metric="erp", title="erp alignment")
plt_alignment.show()
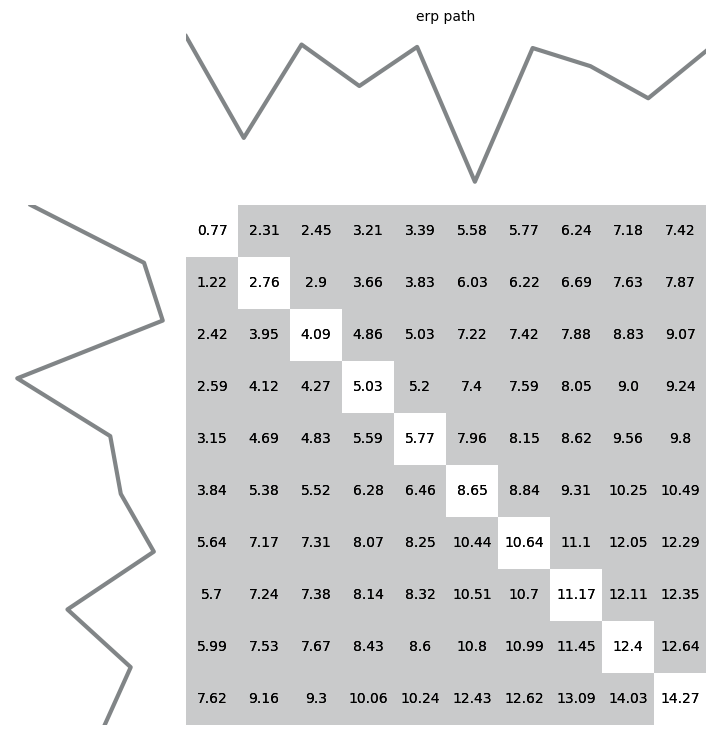
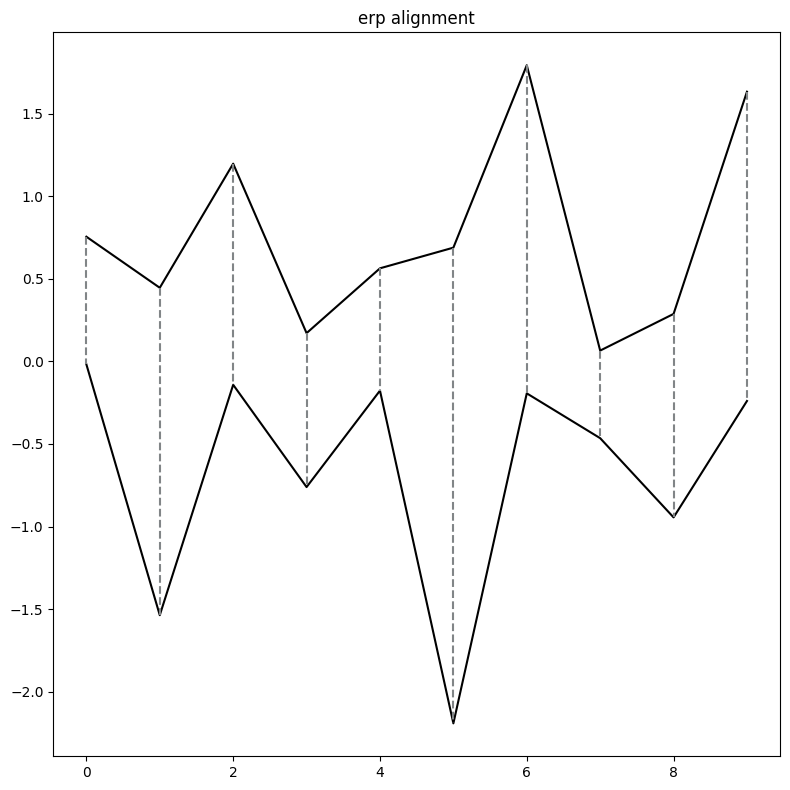
[8]:
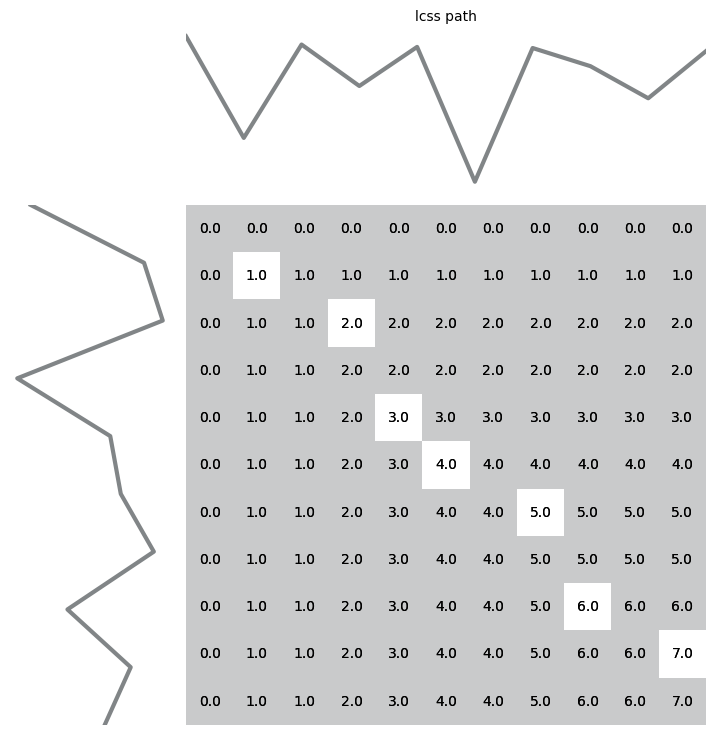
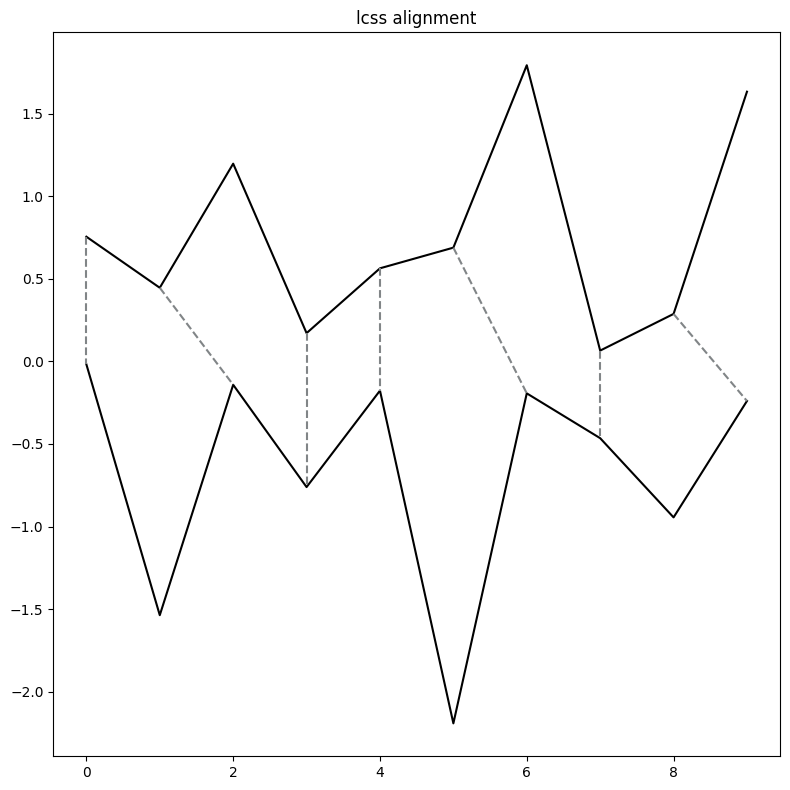
plt_path = _plot_path(x, y, metric="lcss", title="lcss path")
plt_path.show()
plt_alignment = _plot_alignment(x, y, metric="lcss", title="lcss alignment")
plt_alignment.show()
[9]:
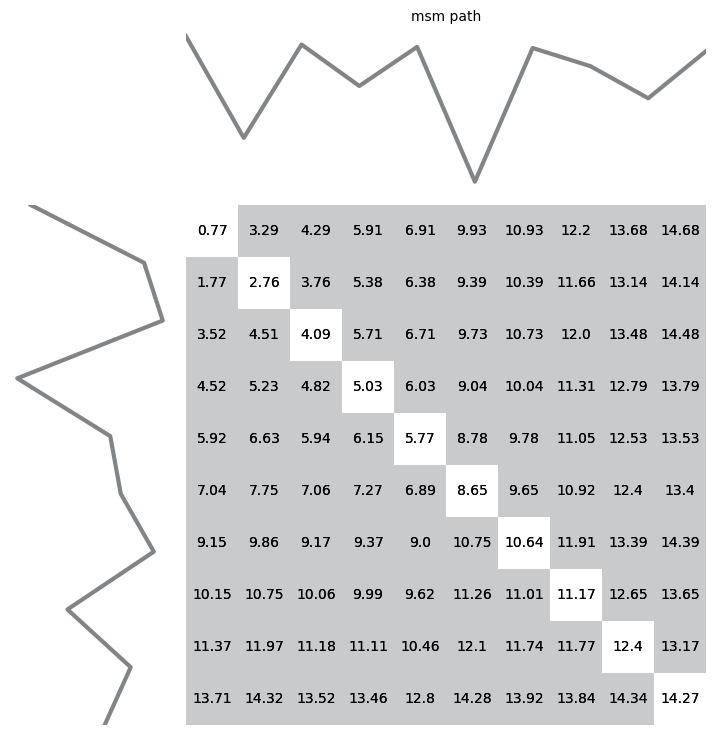
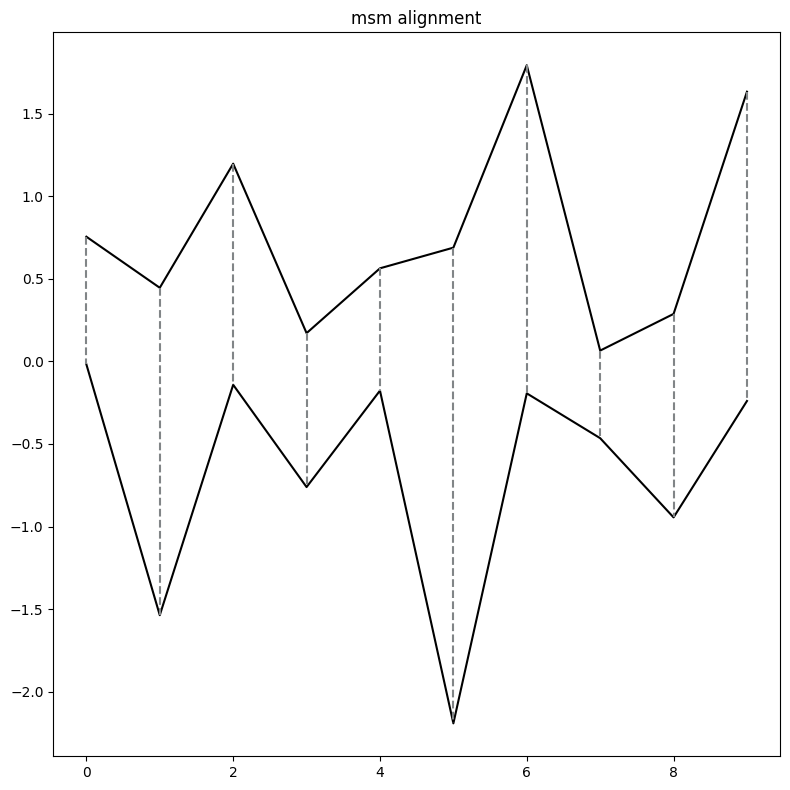
plt_path = _plot_path(x, y, metric="msm", title="msm path")
plt_path.show()
plt_alignment = _plot_alignment(x, y, metric="msm", title="msm alignment")
plt_alignment.show()
[10]:
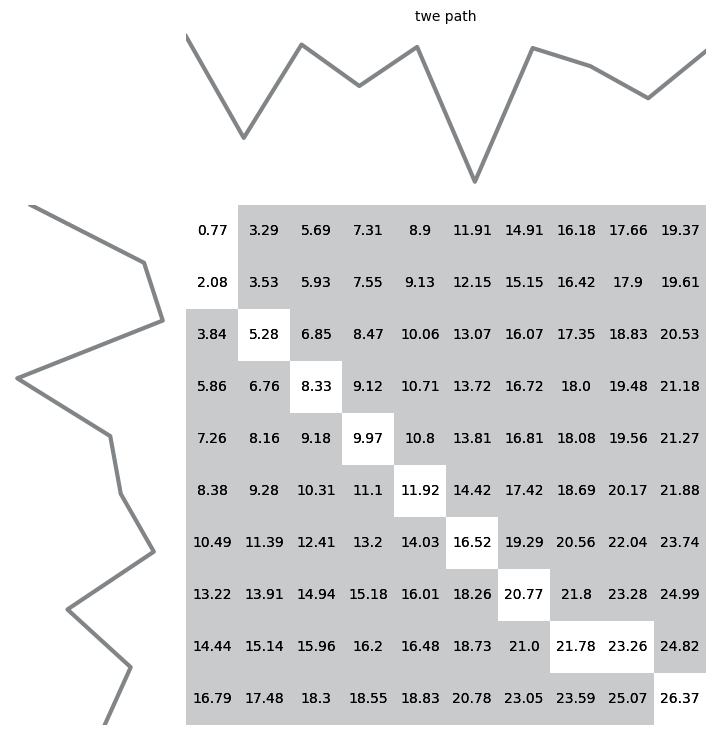
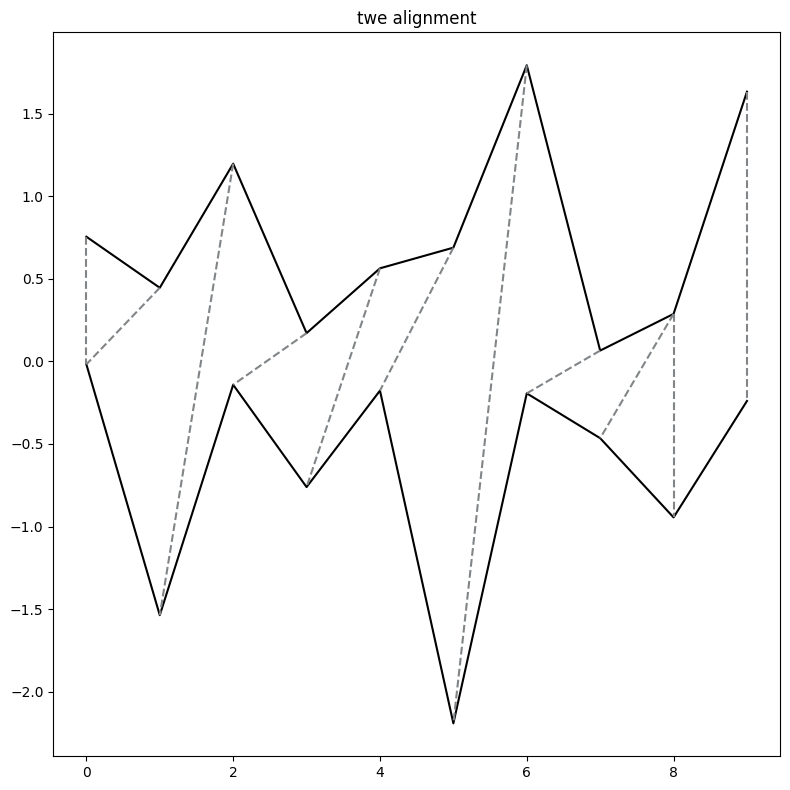
plt_path = _plot_path(x, y, metric="twe", title="twe path")
plt_path.show()
plt_alignment = _plot_alignment(x, y, metric="twe", title="twe alignment")
plt_alignment.show()
[11]:
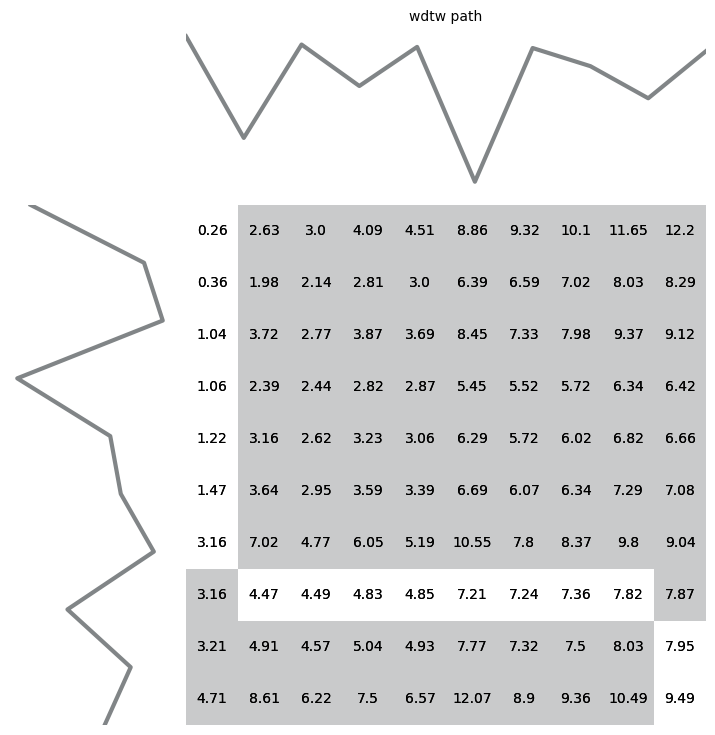
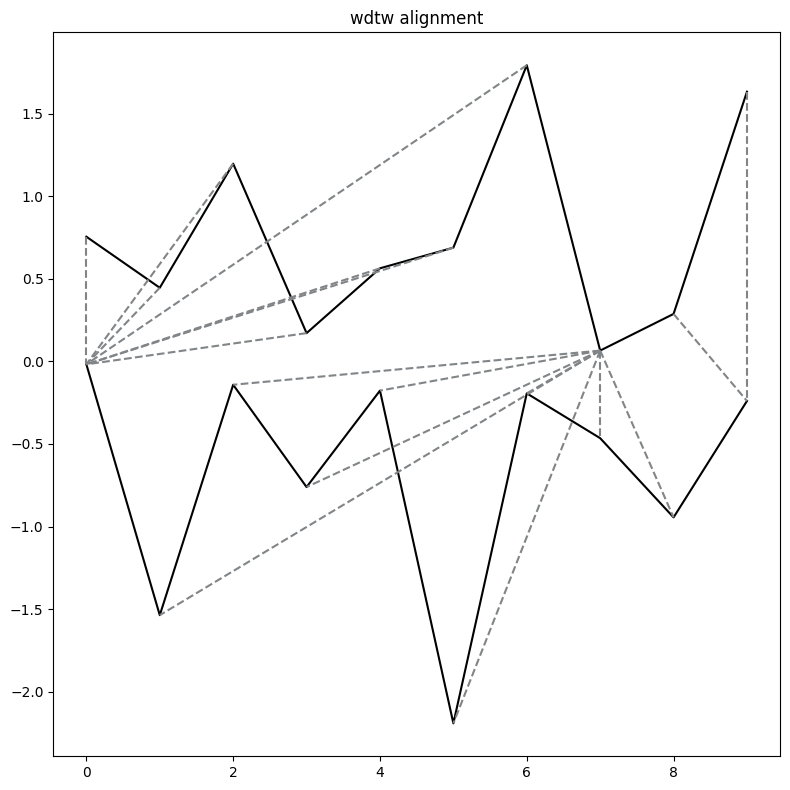
plt_path = _plot_path(x, y, metric="wdtw", title="wdtw path")
plt_path.show()
plt_alignment = _plot_alignment(x, y, metric="wdtw", title="wdtw alignment")
plt_alignment.show()
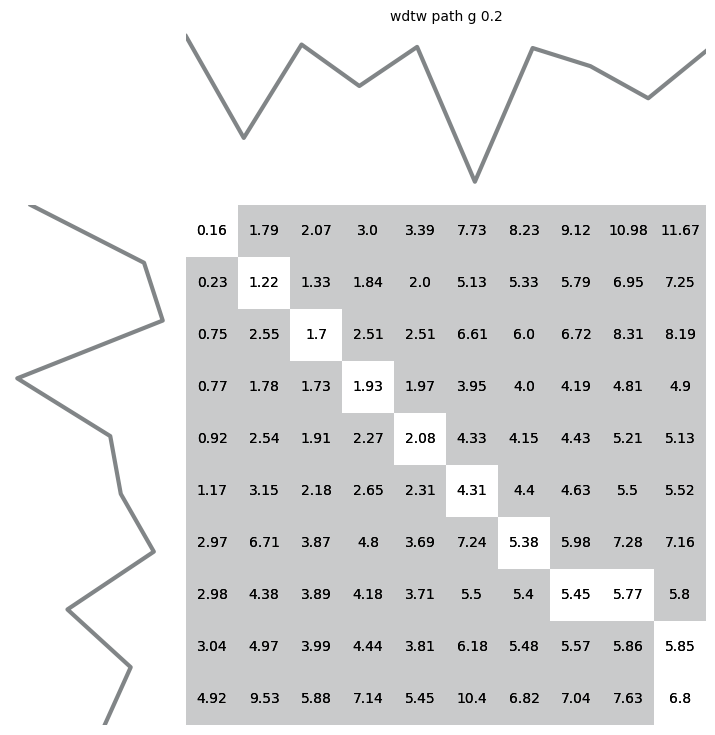
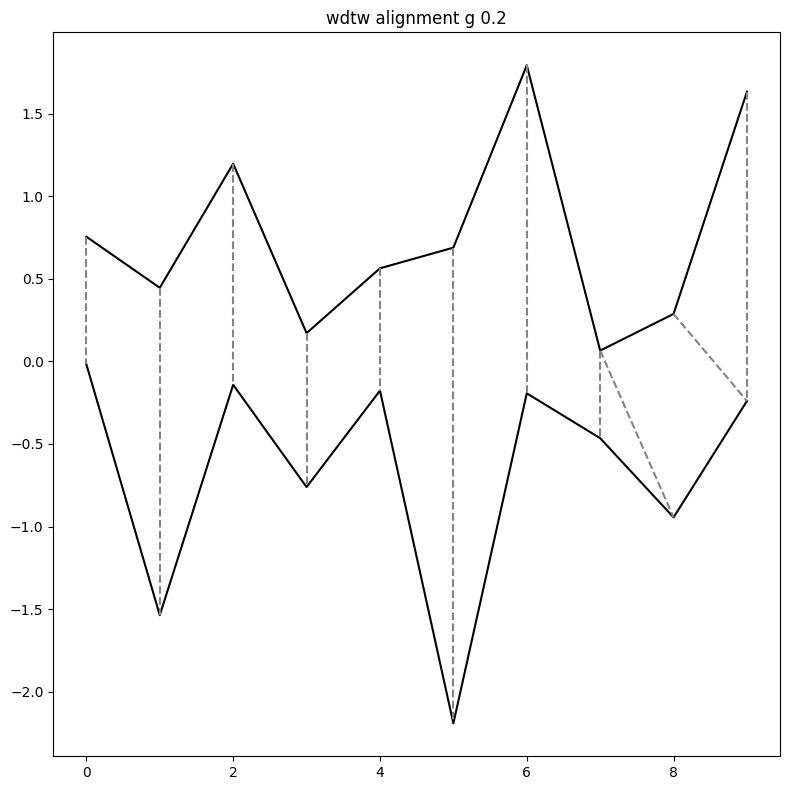
[12]:
plt_path = _plot_path(
    x, y, metric="wdtw", title="wdtw path g 0.2", dist_kwargs={"g": 0.2}
)
plt_path.show()
plt_alignment = _plot_alignment(
    x, y, metric="wdtw", title="wdtw alignment g 0.2", dist_kwargs={"g": 0.2}
)
plt_alignment.show()
[13]:
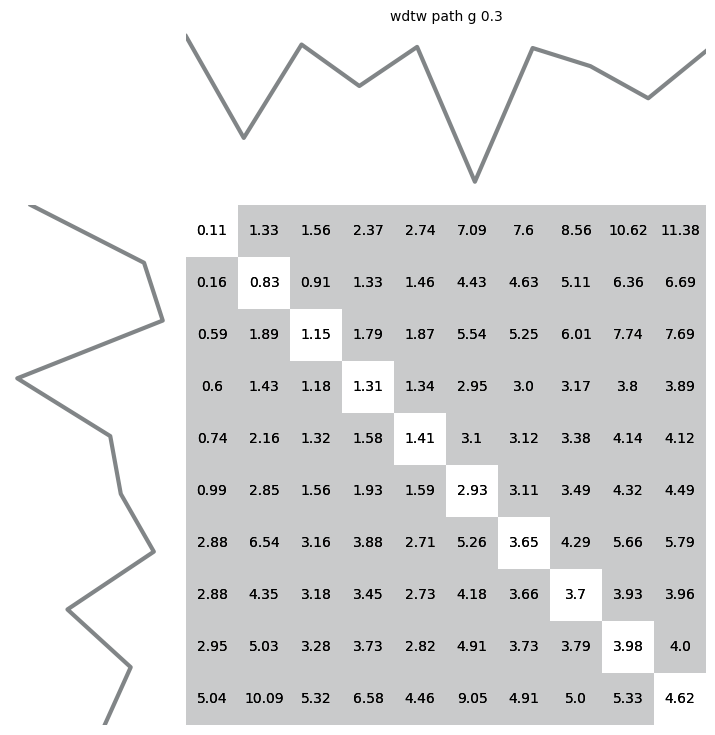
plt_path = _plot_path(
    x, y, metric="wdtw", title="wdtw path g 0.3", dist_kwargs={"g": 0.3}
)
plt_path.show()
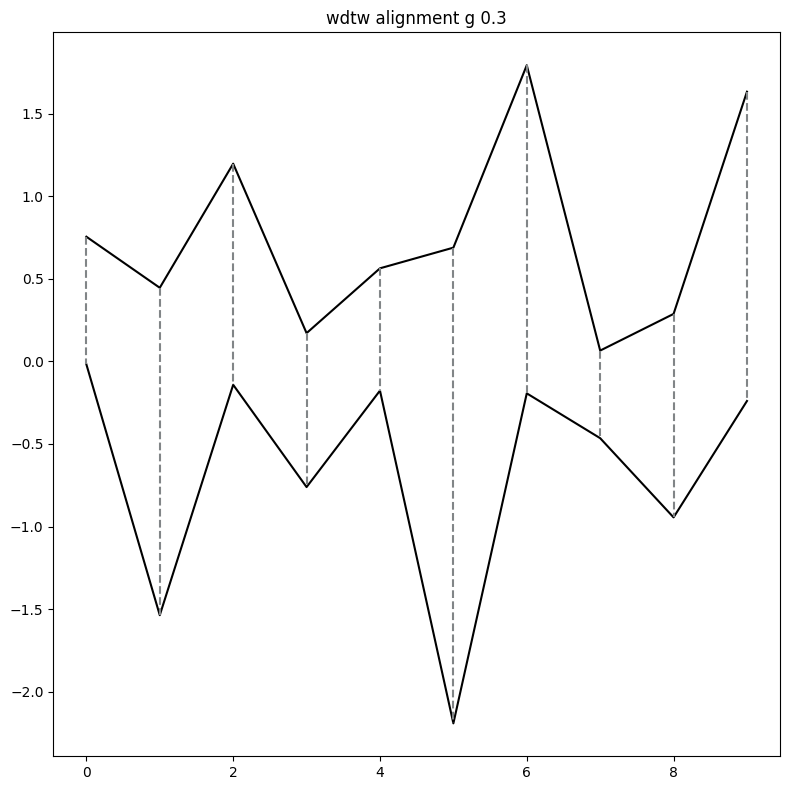
plt_alignment = _plot_alignment(
    x, y, metric="wdtw", title="wdtw alignment g 0.3", dist_kwargs={"g": 0.3}
)
plt_alignment.show()
Generated using nbsphinx. The Jupyter notebook can be found here.